Social Signals
The ultimate Looker Studio SEO campaign dashboard for 2025

Jun


Google’s Looker Studio is a web-based reporting tool that lets SEO professionals and agencies create custom, interactive dashboards to show SEO performance.
What’s so great about it?
Looker Studio puts SEOs and agencies in full control of how they present data, with the freedom to pull from multiple sources. That level of customization isn’t standard in most third-party SEO tools.
Freelancers can easily configure it with a simple Google Sheets.
And agencies, maybe with developers, can provide full end-to-end automation and deployment workflows.
Today, I’ll show you the exact Looker Studio dashboard principles and frameworks we use to generate live SEO dashboards to track real SEO performance.
This ultimate SEO campaign dashboard template is a fresh take on a tried-and-tested design that has roots going back 20 years at my SEO agency.
Why Looker Studio?
SEO reporting is complex. Clients want better insights into SEO performance than what they are getting.
Looker Studio’s flexibility to ingest data from any source allows SEOs and agencies to adapt their reporting to highlight new data points of interest when they need it.
This is especially relevant today as SEOs want to track new data points related to ChatGPT, LLMs, and AI Overviews.
For example, instead of just reporting on keyword rankings, you could report on any Google SERP feature – whatever matters most to your client.
In other words, it’s not a “fixed” dashboard with the same set of metrics. It’s a framework that can evolve with you.
At my agency, we were able to create a flexible “model” dashboard that we can clone for each new client, and then customize it to their needs.
To put Looker Studio’s power into perspective, we were able to replicate the functionality of a leading rank tracking tool – one that arguably took more than a decade to develop – in just a few weeks with Looker Studio.
Now, it’s worth noting that Looker Studio has a steep learning curve, but that’s the trade-off with a tool this flexible.
However, for those with programming experience, Looker Studio becomes even more powerful and easier to use.
Don’t worry, you can piecemeal it
If Looker Studio seems daunting, start small! You don’t have to automate everything right away.
If you’re used to cutting and pasting into PowerPoint, just start cutting and pasting into Looker Studio – it supports that.
When you’re ready to automate one of your charts, the full power of Looker Studio is waiting for you.
(Agencies, this works for you, too!)
It’s nice to deploy a dashboard and know you and your clients can visit it any time, and it automatically stays current.
With the information provided in this article, you can create a dashboard from scratch.
And, if you clone that dashboard and tweak it for a client, those tweaks are evergreen to that client’s report.
In short: Looker Studio offers just the right balance of automation and improvisation.
Over the years, as data sources come and go, prices of data sources go up and down, and accessibility of data sources waxes and wanes, if there’s a data connector (or you can get the data into a Google Sheet), you can provide a consistent, seamless, professional reporting experience through it all.
Looker Studio in 2025
Looker Studio keeps getting better, and a couple of new features in 2025 have made a big impact on your reporting abilities:
Responsive layout
New in Looker Studio is the ability to choose responsive report layouts.
The default has been the freeform layout built for desktops. The new responsive report works for different screen sizes, so people can view it on mobile devices.
For many of us, a pixel-perfect layout is unnecessary. Dropping charts into a preset grid offers rapid report development.
Alerts
While this is only in the Pro version, it’s really handy!
With the new alerts feature, you can be notified of anomalies in your client performance as they occur.
Alerts enable you to set thresholds for the data in your Looker Studio reports.
Say you want to track your top three or top 10 rankings, or keep an eye on a specific keyword.
You can set custom alerts to get notified whenever those rankings change.
This is a great tool for enabling “management by exception,” where you only intervene when deviations from the norm occur.
Next, I’ll show you step-by-step how to structure a basic but complete keyword rankings dashboard in Looker Studio.
Tutorial: Creating a keyword rankings dashboard in Looker Studio
Campaign dashboard example
Here’s a sample of what we’ll be building:

Here are the calculated metrics we’ll develop along the way:
- Current position: The latest ranking position for a keyword in your campaign window.
- Monthly gain: How much a keyword’s ranking position rose (or fell) in the past 28 days.
- Overall gain: How much a keyword’s ranking position rose (or fell) over the lifetime of the campaign.
- Ranking tiers: How many campaign keywords’ positions fall into different ranking bands: Number one, top three, top 10, etc.
A note on information design
The building blocks of SEO campaigns are keywords and pages.
So, the results of your activities will be measured on keywords and pages in rankings.
That said, there are three key elements to a high-performing keyword rankings dashboard for SEO campaigns:
- Keyword/pages detail table.
- Trend chart.
- Summary scorecards.
Let’s discuss each of those further in this article.
Getting started
Log in to Looker Studio and start a blank report.

Tip: If you’re already logged in, type “report.new” in your browser’s address bar to launch a fresh report instantly.

At this point, I prefer to name and save the report before doing anything else, as I’ve found some glitchy behavior from Looker Studio since they launched their responsive layout features.
Select responsive layout
Take advantage of Looker Studio’s new responsive layout features.
It lets you place charts with ease and looks great on mobile, tablet, and desktop.

The keyword detail table
This is the first element of your keyword ranking dashboard.
The keyword detail table shows the individual keyword and page entries, which serve as the fundamental building blocks of your campaign.
Our summary elements, the trend and scorecard charts, will be computed from the data in this table.
1. Create a Google Sheet with your page/keyword assignments

2. Add this sheet as a data source to your Looker Studio report
Click Add Data.

Select Google Sheets.

Choose your sheet.

3. Add a table chart to your report

You should see your keywords.

4. Next, add your keyword rankings
The data model – the format of data provided by your data source – is:
- Date.
- Keyword.
- URL.
- Position.
To follow the patterns described in this guide, you can use any data source that provides these fields in some form or fashion.
Depending on the data connector, some tweaks to field names and data types may be necessary, but the basic principles apply.
If you want to follow along at home, the free Google Search Console data connector in the Looker Studio data source gallery, which can be connected to any GSC site you have access to, is one such compatible data source.
For this guide, we’ll be using a custom BigQuery data source as seen below:

It uses keyword and ranking data from the public dataset in the official Looker Studio Google Search Console report template.
(Note: The format has been modified slightly for this guide.)

5. Add fields for the start and end dates of the campaign
Add Starting campaign date.

Then Latest campaign date. (Typically, this is the most recent date for which data is available. This will soon be used in other formulas.):

6. Add a current position field
This is the most recent ranking position for your keyword.

7. Blend data
Now, you need to connect your keywords configuration with your ranking data. Looker Studio calls this blending data.
In the Setup tab, under Data sources, click on Blend Data.

8. Click ‘Join another table’
Blends let you connect and relate data from disparate sources.

9. Configure your keyword rankings data source
Ensure each field is present in the blend:
- Keyword and Page on your campaign keywords data source.
- Query, Landing Page, and Current Position on your keyword rankings data source.
Also, be sure to shift the keyword rankings data source to the left of the blend.

10. Configure join

Click the two save buttons and return to the report.
11. Add fields to your report
Add Landing Page as a dimension and Current Position as a metric.
Some folks find the decimal places on average rankings to be noisy.
So if you’re using GSC as a ranking data source, you may configure the position formatting to omit them.

12. Save space by omitting the website in your landing page URLs
Replace Landing Page with a calculated field that strips the website.

13. Rename query to keyword
Since you’re just focused on keyword rankings here, let’s rename Query to Keyword.
In the Setup tab, click on the little ABC icon to the left of the Query dimension.

14. Configure comparison metrics for your keyword detail table
Here, you’ll fetch the keyword’s position 28 days before the latest position in your campaign.
This will be used to calculate your monthly gain.

The position at the start of the campaign:

Position improvement since the start of the campaign:

Make a similar one for Monthly Gain.

Add them to the keyword detail table:

Get the newsletter search marketers rely on.
MktoForms2.loadForm(“https://app-sj02.marketo.com”, “727-ZQE-044”, 16298, function(form) {
// form.onSubmit(function(){
// });
// form.onSuccess(function (values, followUpUrl) {
// });
});
The trend chart
The second element of your campaign dashboard is the trend chart.
There are many ways to summarize an SEO campaign’s performance. One practical way is through ranking tiers.
How many keywords are ranked in the Top 3, Top 10, Top 30, etc., at any given moment?
The trend chart lets you see a visual summary of your ranking performance over time.
Add a Top 3 metric in your keyword rankings data source

Repeat for each ranking tier
Repeat the previous step for each ranking tier until they’re all filled out as illustrated below.

Hover between the header and the keyword detail table to reveal the button to create a new section

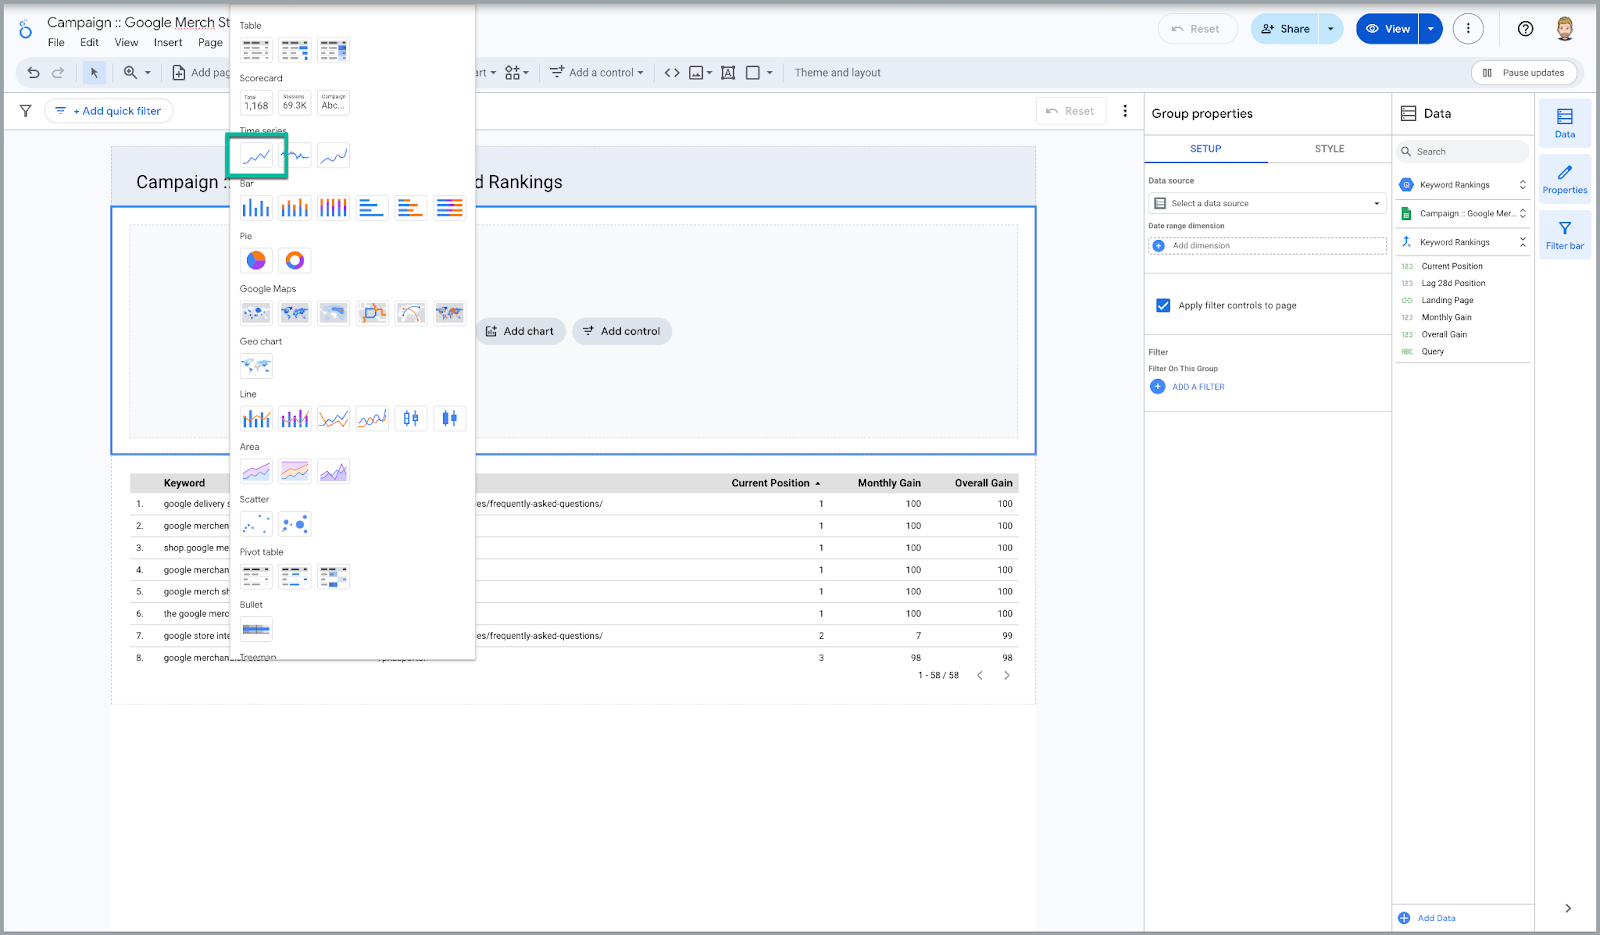
Add a time series chart
This is where you can show the ranking trend of your campaign. People love graphics.
Now add the ranking tier metrics to your blend
In your left table, drag each ranking tier from Available Fields to the Metrics section.
Also, add the Date field as highlighted below.

Add the Top 3, Top 10, and Top 30 metrics to your chart
In the Setup tab, add your time series metrics.

The scorecards
The final element in your keyword rankings dashboard is the scorecard.
Scorecards attempt to sum up how well a campaign is going in a single number.
Our scoreboard metric will be your current ranking tiers: Keywords in the top three, top 10, etc.
Add a section for your scorecards
Add a new section between your header and trend chart by hovering between them:

Add a scorecard chart

Configure the scorecard
- Ensure you’re using the blend as the data source.
- Set the metric to tier No. 1.
- Set the date range to the last date of your campaign.

Repeat for each ranking tier
Repeat the last two steps to show a scorecard for each ranking tier across the top line.

Congratulations, you’ve just configured your first Looker Studio keyword rankings dashboard!
Where to go from here: Tips to expand your dashboard
This isn’t just an SEO dashboard, it’s an SEO dashboard builder.
Along the way, you’ll pick up the skills to evolve, extend, and tailor it to the needs of your business or clients.
Here’s what other folks are doing with it, and now you can too!
Add monthly search volume metrics (MSV)
If you have a source of MSVs that you prefer, add them to a Google Sheet and blend them right into the report.
Estimated clicks
If you’ve got MSV numbers, you can combine that with your position data and public SERP CTR tables to calculate estimated clicks based on ranking improvements.
Estimated clicks can be a better signal than “actual” clicks (particularly in the first six months of campaigns) because of variance (like seasonality) and missing data.
SEO share of voice
Instead of (or in addition to) estimated clicks, calculate how your campaign is doing relative to select competitors.
Rankings heatmap
Add three (or N) trailing period columns to the keyword table, apply heatmap formatting to them, and you have an eye-catching rankings trend visualization. People love this.
Customize the ranking tiers
Use whatever tiers you like!
Add keyword lists
Add a column to your keywords/pages Google Sheet called List. Now you can segment your keywords into separate campaigns.
Add a drop-down list control to your dashboard to switch between them, or summarize them all in aggregate.
Just watch for double-counting in the keywords table.
Add seven-day or 28-day averages
Add a calculated field that shows the seven-day or 28-day average.
This is especially handy if your dataset doesn’t provide daily position samples or is running into Google’s SERP scraping mitigations.
Add SERP feature ranking columns
If you track positions in certain SERP features, e.g., Google’s AI Overviews, add a calculated metric for that. It can be as simple as a Google Sheet.
Add SERP feature icon columns
If you have the data, add an icon field for SERP feature presence, like Answer Box. Use emojis for the icons.
Add GSC or GA4 traffic
With a blend of the free and official GSC or GA4 data connectors, you can insert traffic numbers right next to the rankings.
Causal lift reporting
A special mention for customizations to report on cause-and-effect.
More and more, we’re hearing that clients and prospects are dissatisfied with just charts and tables.
They want marketers to connect their activities to metric outcomes. They want marketers to demonstrate how their recommendations resulted in performance gains.
With a little creativity, you can tailor Looker Studio to provide these signals. Here are some tips:
Include analyst task delivery
Make adding completed tasks to a Google Sheet part of your meeting process.
If you already track tasks in Google Sheets, even easier. And you already learned above how to blend Google Sheet data into report tables.
This easily scales out to automatically pulling tasks into reports from Basecamp, Monday.com, Trello, etc.
Include client task delivery
It’s not just you who is responsible for tasks. For an SEO campaign to work, the client is accountable for task completion, too.
The best way to handle client task accountability is to make it transparent: Automatically blend a shared Google Sheet into your reporting with “assigned at” and “finished at” dates.
This is a really easy, low-friction way to nudge clients in the right direction.
Add annotations to the trend chart
If a new batch of page optimizations were deployed on a client site at a certain date, and the line chart goes up right after, you have a good case for causal lift.
(While it isn’t officially supported, folks have come up with plenty of easy workarounds – Google it.)
This one is really handy.
Building SEO reports that clients actually want
Effective SEO reporting is no easy task. But with Looker Studio, it becomes much more flexible and powerful.
With the framework outlined in this article, SEOs and agencies can create insightful, scalable reporting systems that show true SEO performance.
For more help, you can check out the following Looker Studio documentation:
- Looker Studio Documentation – New Features.
- Looker Studio Overview.
- Looker Studio Newsletter.
- Looker Studio Pricing.
#ultimate #Looker #Studio #SEO #campaign #dashboard